Do you have a strategy in place for finding high impact conversion-related pages? In this post I will share all about participation metrics and how I use them in CRO.
There are many factors you need to consider in a conversion optimization process.
To keep things simple, I like to solely focus on answering this question:
“Where are you going to run your next A/B test?”
After reading this post you have a much better understanding about finding pages that matter for CRO.
Participation Metrics
First of all it is important that you understand the term “participation metrics”. Chances are that you haven’t heard about this term before.
Let’s do a search in Google: You can see that “participation metrics” is a term that is often used in relation to Omniture/Adobe Sitecatalyst.
As a frequent user of both Google Analytics as well as Adobe Analytics, I can state that both packages can help you out here.
In the rest of this post I will concentrate on Google Analytics since it is probably used by most of you.
A few things to know about participation metrics:
- Participation metrics help you to define the importance of your pages in relation to one or more conversions.
- Participation metrics are closely related to attribution analysis.
- Participation metrics can be defined on the session or user level.
- As (most often) A/B tests are judged on the user level, I prefer to use user level metrics.
- Participation metrics can be used on both ecommerce as well as non-ecommerce sites.
- Participation metrics are less useful for low volume and/or low conversion website (< 10K users and < 1K conversion p/month)
How it Works
Usually a website visitor sees a couple of pages before she converts.
Don’t think that the path to conversion is always a straight line. This is sometimes the case for highly goal-oriented website visitors.
For example, if a visitor sees six pages before purchasing your product, the conversion credit is distributed among those six pages.

You can choose to either work with “real” values or use relative values. It’s up to you.
This is the same as when you are setting up your goal values in Google Analytics.
Case Study Example
In this chapter I will explain about how to work with participation metrics in Google Analytics. As an example I use one of my websites that I built a few years ago.
Website
- http://bestproteinpowdertips.com/.
Macro Conversion (Primary Goal)
- Send website visitors to Amazon.com (click on Affiliate link).
- Measured as event and recorded as goal 1.
- Active goal on almost every website page.
Measurement Period
- 1st June 2014 to 31th August 2014.
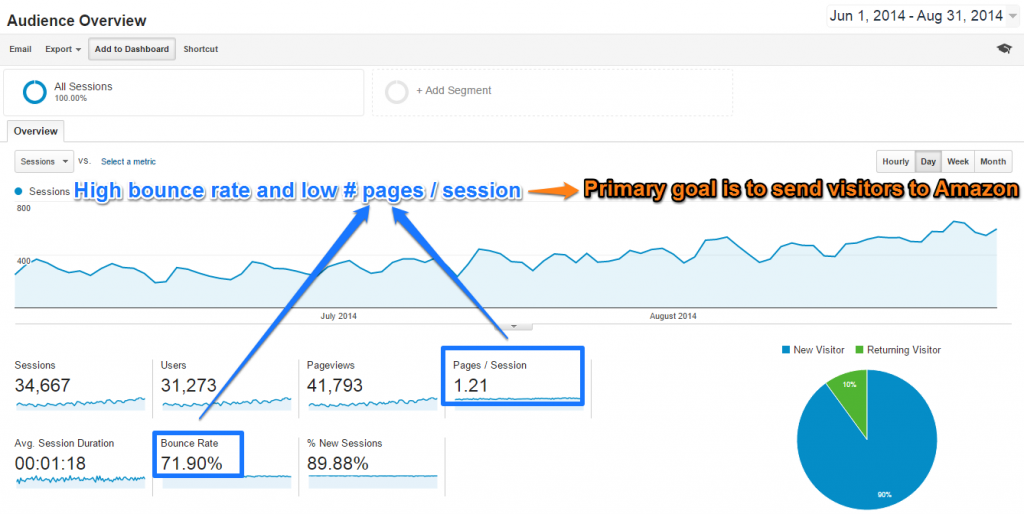

By now you have some background information on this website and it’s purpose.
Custom Report
I already explained that I like to focus on user level metrics. This is why I need to build a custom report:
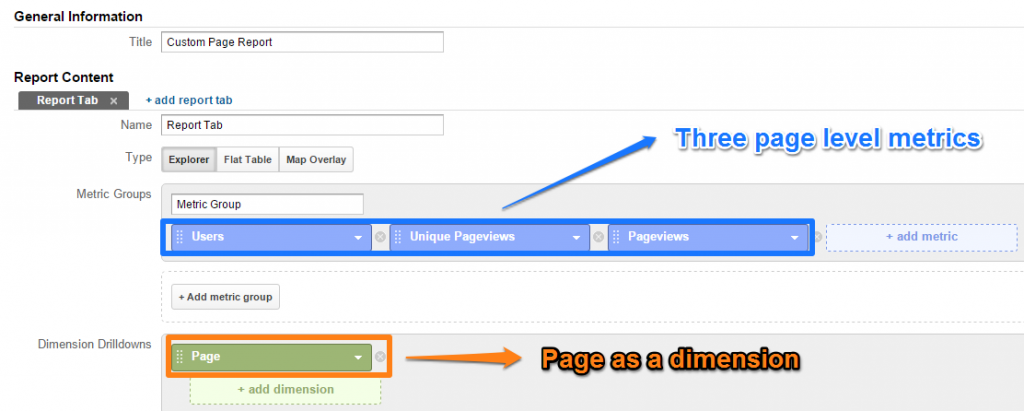 The actual reports looks like this:
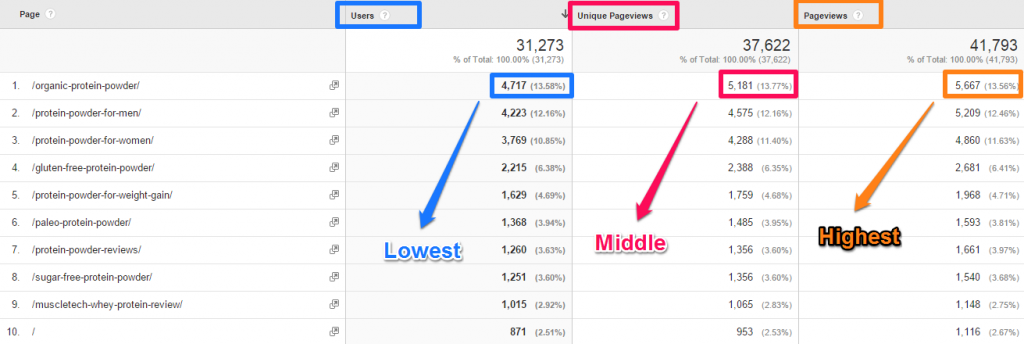 As expected, on the user level the numbers are the lowest and on the pageview level the highest.
The blue number tells you how many users saw a certain page.
Now I will show you the same report with a segment on converters (sessions where a click to Amazon.com was recorded in Google Analytics).
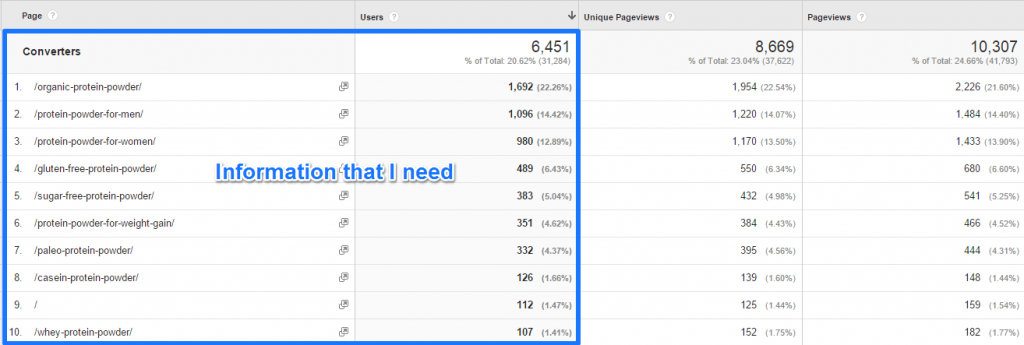
Now let’s combine the information:
 Learn how to build this segment and other segments with this in-depth guide on Google Analytics segmentation.
Data Interpretation
In this case there are a few things to take note of:
- Huge difference in users that converted (clicked on Amazon affiliate link) between different longtail keywords/pages in top 10.
- Partly related to organic ranking differences at that time.
- Extremely high converted users percentage on “organic protein powder” and “sugar free protein powder” page.
Make sure to always interpret the data in context.
Normally a high percentage of converters in combination with a high absolute number of users on the page, suggests that the page is a good option to further optimize (with A/B testing).
However, in this case on almost every page there is a goal conversion possibility (click through link(s) to Amazon).
CR is directly linked to rankings in Google. Since most conversions happen directly on the landing page.
Action Steps
- Outreach and effective content strategy to rank higher on different protein powder pages.
- A/B test on top 8 pages (except organic and sugar free protein powder page).
- A/B test on template level to increase CR on all deeper product detail affiliate pages.
Fictional Example
The calculation behind page level user conversions is the same if you are dealing with a website that has one macro goal on just one spot.
In this context you can think about:
- Blog website with one newsletter subscriber box.
- Ecommerce website with one “thank you” conversion page.
- Leadgeneration website with one “thank you” page after leadgen form.
Example of users that converted against website page type or funnel step:
 It’s quite logical that the absolute number of users that convert is higher if you get closer to the conversion point.
I hear you think, but why should we calculate this metric. We know upfront that we should test in the booking funnel right?
Well to be honest this is just one of the steps of a more complicated process that I use to determine pages for A/B testing.
Create Your Own Magical Formula
I will give you a few more tips here to get you going.
You need to think in two directions:
- How much can I win here (gain of A/B testing)?
- How much does it take to test here (ease of A/B testing)?
![Ease - gain matrix]() Always Look at an Aggregated View
Always Look at an Aggregated View
If your website counts 1.000 product detail pages (on same template), you should aggregate these pages in your analysis. Content grouping is a good option here.
Distance to Conversion
Another factor to take into account is distance to conversion. You can use relative percentages (0 – 100%) to map out your pages.
Political Barriers
Pages get less attractive if there are a lot of political barriers for testing this page. On the other hand, if there are no political obstacles it is more easy to test on a certain page.
Technical Barriers
Is it hard to implement a winner on a page or almost impossible? Take this into account in your A/B testing plan.
Calculation Period
You should base your calculation on a period of approximately two to four weeks. Best practice is to keep your participation metrics calculations within your A/B test period range.
This is it for now. I hope you have learned a few new things again.
Do you have a (data) process in place for selecting your A/B test pages? Happy to hear your thoughts!
One last thing... Make sure to get my automated Google Analytics Audit Tool. It contains 25 key health checks on the Google Analytics Setup.The post Case Study: How to Leverage Participation Metrics for CRO appeared first on Online Metrics.
 Always Look at an Aggregated View


